
Have you ever participated in a Kaggle’s playground competition? I recently took part in one that aimed to predict the chance of a stroke based on various factors like age, gender, glucose levels, BMI, and more. The data provided for these competitions can be a bit messy, with added noise and outliers, so it’s important to start with some good old-fashioned data preparation and cleaning.
First thing I look for is null-values. Mercifully, in playground series they don’t usually add null-values (not always) to make life easier for us, since it’s a playground right?
Next thing is getting to know the features and their meaning and also seeing how the data is organized in those features. This table shows the unique values of categorical features:
| Feature | Unique Values | # of Unique Values |
|---|---|---|
| gender | [Male, Female, Other] | 3 |
| hypertension | [0, 1] | 2 |
| heart_disease | [0, 1] | 2 |
| ever_married | [Yes, No] | 2 |
| work_type | [Private, Self-employed, Govt_job, children, Never_worked] | 5 |
| residence_type | [Urban, Rural] | 2 |
| smoking_status | [never smoked, formerly smoked, Unknown, smokes] | 4 |
We have numbers, yes or no, labels with non-standard format, etc. The values obviously needs to be uniformed. So I mapped each category to an integer and saved the map in a dict for further visualization purposes.
But there were still lots of outliers and artifacts in there.
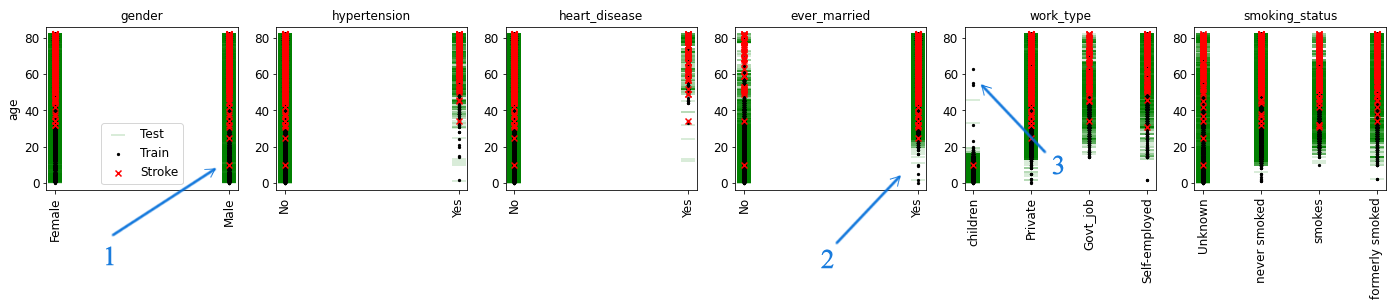
- An unfortunate ~10-year-old who got stroke.
- Married children!
- Old children!
The data had just too many funny outliers like that. I spent some time getting the rest of data in order and analyzing it, but with my work research taking up much of my time and the competition’s one-week deadline, I couldn’t spend much time creating and tuning the prediction model.
In the last day of the competition I had everything ready to build the prediction models. But you can only submit 5 prediction results each day.
I turned to ensemble method. Ensemble methods can be incredibly powerful by combining the predictions of multiple models you can harness the strengths of each and minimize their weaknesses, leading to a much more accurate result. Here is how I setup the models:
# Initialize models
models = [
    ('lr', LogisticRegression()),
    ('dt', DecisionTreeClassifier()),
    ('lgb', LGBMClassifier()),
    ('xgb', XGBClassifier()),
    ('knn', KNeighborsClassifier()),
]

# Define the parameter grid for Logistic Regression
param_grid = {
    'dt': {
        'splitter': ['best', 'random'],
        'max_depth': [None, 2, 3, 5, 10, 15],
        ...
    },
    'knn': {
        ...

# Iterate over models. I know it didn't need a comment. Just to be aesthetically pleasant
for name, model in models:

    # Initialize the Search object (RandomizedSearchCV or GridSearchCV can be used here)
    search = RandomizedSearchCV(model, param_grid[name], scoring='roc_auc', n_iter = n_iters[name])

    # Fit the Search object to the data
    search.fit(X_train, y_train)

    # Save the best parameters
    param_grid[name] = search.best_params_
It’s pretty easy to implement in python. The rest is training the models with the best parameters and use them in ensemble classifiers. By finishing the basic setup and testing the results I used all my 5 chances. I further fine-tuned my models' hyper parameters and shared the results with a fellow Kaggler. He ended up placing 11th in the competition, and even though I only came in around 500th, I was thrilled to see that my code had performed so well.